Mastering BI: Key Business Intelligence Features & Capabilities
Business
Business Process Automation

In this article, you will learn about business intelligence tools. We cover the core concepts, explore key trends, and highlight the benefits. Detailed information about the features will help you assess what your business truly needs. At the end of the article, we explore BI essentials for five industries: ecommerce, retail, logistics, AI, and enterprise.
Reading time: 16 min.
Do you require a solution to turn raw data into insights that can help you understand the heart of your business and guide it accordingly? If the answer is yes, implementing a business intelligence solution early on might be a wise move.
In this article by IntexSoft, you will learn more about the options available and take a closer look at how businesses can specifically benefit from such solutions.
These are powerful tools that enable any organization to efficiently analyze, visualize, and report on data. By integrating these applications, you can easily access and interpret data, run detailed queries, generate comprehensive reports, and utilize advanced predictive analytics—all tailored to your business needs.
Investing in business intelligence software can be approached in two effective ways:

When you take a hard look at the current market landscape, a few names consistently rise to the top—Microsoft and Tableau, chief among them. These giants are dictating the pace and direction of innovation. With significant investments in research and development, they carve out the path that others must follow.
But what are the prevailing trends that you need to be aware of?
It’s important to identify BI features that address your unique business needs while reflecting the latest industry trends. This segment of our article will thoroughly examine and illuminate the essentials of business intelligence capabilities.
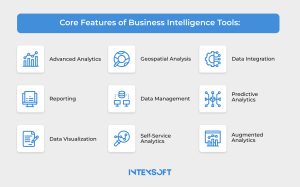
Let’s examine the essentials, including BI reporting tools and various analytics tools, in more detail.
Advanced analytics is on the front page of modern data analysis. You can explore and interpret complex datasets thoroughly. It enables businesses to conduct regression analysis, which uncovers the subtle connections between dependent and independent variables. This level of analysis is truly valuable for grasping how different elements influence one another and for predicting future trends with astonishing accuracy.
Looking to see how your future choices might play out? Advanced analytics gives you the total capacity of what-if analysis tools. These tools use past data to predict what might happen, giving you ideas of the risks and rewards involved. This analysis is a must for strategic planning, showing you exactly what could happen with each decision individually.
Let’s focus on scenario analysis. Why is this technique valuable? Users can alter key parameters, such as market fluctuations or operational changes. By modeling these scenarios, firms can better appreciate the spectrum of possible impacts. Spectrum. As a result, you gain a broad picture, as if someone turned on a light, allowing you to stay in red alert.
Calculating the mean, median, mode, and standard deviation are just the beginning in advanced analytics. The real depth of analysis is uncovered through metrics like kurtosis and skewness, which offer critical insights into data trends and unexpected anomalies.
An intuitive BI reporting tool places report creation and distribution in your hands, bypassing the need for IT support. You can set reports to be delivered automatically on a schedule and configure alerts to ensure they are sent.
Make your data pop with conditional formatting that highlights important cells in your reports when certain conditions are met. Plus, with interactive tools, you can get hands-on—filtering, drilling down, pivoting, and customizing rows and columns until you have got exactly the information you need, just the way you want it.
Modern business intelligence tools have elevated data visualization to a new level, transforming complex datasets into visuals. Tools such as Tableau and Power BI are leaders in this field. They enable users to create everything from straightforward bar and pie charts to more complex heat maps and geospatial visualizations.
Executive dashboards provide C-level business leaders with a real-time performance overview, combining various graphs, charts, and summaries. For example, a sales dashboard could integrate real-time sales data with pipeline status and regional performance metrics.
With drill-up and drill-down features, users delve into the data, from broad summaries to details. Enrich the interactive experience through functions such as scaling, sorting, filtering, tooltips, and highlighting.
Geospatial analysis is one of the components of modern business intelligence, which provides a means to visualize data within a geographic framework. The very first you gain is geographic map search capabilities. Businesses can quickly identify specific locations, from broad regions to individual sites, on a map. Consider this point a door to 100% efficient regional performance monitoring.
Raw data is transformed into engaging and informative visual formats. For example, a retail business might use this feature to map out sales data across different areas, marking successful regions in green and less successful ones in red.
Whether improving delivery routes for logistics or pinpointing effective advertisement regions, this tool is on track to become important.
Data management begins with data preparation, a crucial step that involves refining and combining data to ensure it is ready for analysis. This process, while fundamental, echoes the importance of previous points. By aggregating diverse datasets—such as sales figures and customer feedback—organizations can forge comprehensive datasets that reveal critical trends and insights.
How do these insights come to light? Visualization tools, such as heat maps and trend lines, play a pivotal role in demystifying the data. A heat map, for instance, can visually distinguish high-performing regions from those underperforming, while trend lines can graphically depict changes and patterns over time.
OLAP (Online Analytical Processing) functionalities enhance this analytical depth. Tools like drill-up and drill-down enable a shift between broad and granular data views. At the same time, slice-and-dice techniques allow for the segmentation and examination of data from multiple perspectives.
As businesses rely more heavily on data to shape their strategies, one thing becomes clear: everyone—from data analysts to customer service agents—needs the right tools to extract insights.
A powerful business intelligence platform should make this possible, fostering a culture where data-driven decisions are the norm. Self-service analytics empower teams to explore data independently, allowing marketing to refine campaigns and sales to identify trends.
Even the most advanced business intelligence tools fall short if they cannot seamlessly connect with your existing data infrastructure.
A well-engineered analytics platform should provide optimized native connections, ensuring that data analysis is both rapid and reliable, regardless of where the data is stored—whether in the cloud, on-premises, or across multiple systems.
Consider a retailer using an ERP system for inventory management and a CRM tool for customer relations. The ability to merge these data streams within a single BI platform not only enhances the depth of analysis but also supports strategic decision-making. Furthermore, the capability to query databases quickly, without the need for custom coding, is a significant asset for businesses that require real-time insights. For example, an eCommerce firm can effortlessly extract sales data from its platform and cross-reference it with customer feedback, allowing for data-driven decisions that do not disrupt the existing infrastructure.
To thrive in business, the ability to predict what will happen next is important. This is where predictive analytics comes into play. By drawing on data mining, machine learning, and AI, it enables businesses to analyze both current and past data effectively.
Let’s consider its application in fraud detection. Predictive analytics can generate reports that highlight suspicious transactions by identifying irregular patterns, making it easier to detect fraudulent activity. It also plays a key role in preventing inaccuracies in credit applications and uncovering false insurance claims.
This technology offers truly valuable insights into customer behavior, allowing businesses to pinpoint cross-selling and upselling opportunities with greater accuracy.
It’s about new horizons in analytics. By harnessing the power of machine learning, you can strength businesses to nimbly pivot and seize opportunities amid rapidly shifting conditions. And with all of that, you face a period of transformation that could lead to improvements in both existing and new areas.
For example, it can automatically flag unusual shifts in sales data—like an unexpected drop in a typically strong-selling product—prompting an immediate review and adjustment of marketing strategies. Additionally, this technology uncovers hidden customer segments, such as a new group of buyers with distinct purchasing patterns.
Augmented analytics identifies key patterns—like correlations and trends—before you even begin analyzing the data. With intuitive text and voice search features, it makes sophisticated data analysis accessible to everyone in the company, ensuring that insights are easily within reach.
The adoption of BI proves indispensable in some sectors. The ability to leverage data effectively often separates successful enterprises from those that fail to keep pace. IntexSoft’s deep expertise in BI implementation supports organizations in these critical industries to realize their full capabilities. So, which industries are we talking about?
Here’s a table highlighting specific features of BI business intelligence software that are beneficial for five key industries: Ecommerce, Retail, Telecom, Enterprise, and Logistics.
| Feature | Ecommerce | Retail | Telecom | Enterprise | Logistics |
| Advanced Data Analytics | Analyze customer behavior and sales trends | Optimize inventory and pricing strategies | Predict network usage and customer churn | Improve decision-making with comprehensive data views | Optimize route planning and resource allocation |
| Personalization | Customize shopping experiences | Deliver tailored promotions and offers | Offer personalized service plans | Customize employee and client engagement strategies | Tailor logistics services to customer preferences |
| Real-Time Reporting | Monitor KPIs with real-time dashboards | Track sales and stock levels in real-time | Monitor network performance and service levels | Provide real-time insights for management | Real-time tracking of shipments and deliveries |
| Customer Segmentation | Target marketing based on customer groups | Segment customers for targeted campaigns | Segment users for targeted communications | Segment internal teams and external clients | Categorize shipments based on priority and service |
| Supply Chain Optimization | Enhance supply chain efficiency | Streamline supply chain and inventory management | Optimize the supply chain for network equipment | Improve supply chain transparency and efficiency | Optimize logistics and supply chain operations |
| Fraud Detection | Identify and prevent fraudulent transactions | Detect fraudulent activities in transactions | Prevent fraud in service usage | Monitor for fraud in financial operations | Detect and prevent fraudulent logistics activities |
| Customer Retention | Develop strategies based on feedback and loyalty data | Enhance customer loyalty programs | Retain customers through data-driven strategies | Improve employee retention and client satisfaction | Boost customer loyalty with reliable service |
| Marketing Optimization | Track and optimize marketing channels | Optimize marketing spend across various channels | Enhance marketing effectiveness | Refine marketing strategies based on data insights | Optimize marketing and client acquisition efforts |
| Automated Data Integration | Simplify data integration from multiple sources | Integrate POS, CRM, and inventory data seamlessly | Integrate data from various network operations | Streamline data from multiple business units | Integrate data across supply chain and distribution |
| Scalability | Scale data solutions with business growth | Expand BI tools as the business grows | Scale BI infrastructure as the network expands | Adapt BI tools to growing enterprise needs | Scale BI tools with logistics network expansion |
If you’re a business оwner or C-level executive, and you’re looking to ensure that a business intelligence solution will address all your needs and unlock new avenues for growth, IntexSoft is ready to help. It’s only natural to have doubts—serious decisions demand careful thought, a balance of risks, and rewards. We’re prepared to offer a free consultation, laying out the clear, tangible benefits you can expect to see in the near future.

This post is about 5 reasons you need a business analyst on your project.

You will explore the specifics of business intelligence in logistics.

Let’s learn how to harness the power of AI-powered analytics to gain valuable insights and make data-driven decisions. This article discovers the latest tools and techniques for leveraging artificial intelligence in your analytics strategy.